In an increasingly remote and distributed workforce, enterprise processes must run like clockwork, especially processes focused on customer experience. You may have already read about the how desktop analytics support better customer experiences, which is more important than ever in the face of increasingly digital and contactless interactions. However, optimized use of desktop process analytics can take you even deeper than those critically important customer interactions. Desktop process analytics can help you go beyond fixing process problems at the surface and reimagine those critical processes from end to end.
One important tenet of Pega’s Center-out® business architecture is to begin with a microjourney, or a segment of a customer journey tied to an outcome. This is something desktop process analytics (like Pega Workforce Intelligence) can address right away. For example, the average handle time of a call in the contact center may be painfully high because the customer service agent must copy and paste customer info between the various legacy systems they depend on to meet customer needs. Enterprises can determine where the legacy system bottlenecks are causing the most customer pain and then use technologies such as RPA to address them.
This is a great example of desktop process analytics being used to solve for a microjourney. However, it doesn’t have to stop there. The right desktop process analytics solution will not only tell you about the effectiveness of individual tasks, but will also provide insights on the entire process, so that enterprises can holistically improve, and in some cases, completely redesign critical desktop processes and end-to-end workflows.
By looking at the entire desktop process from end-to-end, desktop process analytics can reveal a myriad of deeper-rooted issues with operational efficiency. Some examples include where application dependencies are creating process bottlenecks or failures and where insufficient structure is leading to an unsustainable number of process variations. These situations are obviously bad news for business outcomes and customer experience.
But when dealing with the disparate, multi-vendor, and legacy realities of business architectures, knowing where to focus data gathering and analysis can be overwhelming. There are many applications, systems, processes, and human-driven actions to analyze. However, within optimizing these different process components are wildly varying returns on investment (ROIs). How do you know where to focus?
Keeping score of digital transformation with desktop process analytics
For all the value of deep-dive data analysis, it is also important to see the big picture in desktop process analytics – i.e., the score. Digital transformation moves fast, and knowing the score allows the enterprise to jump right into asking the right questions with data and solving the problem at hand.
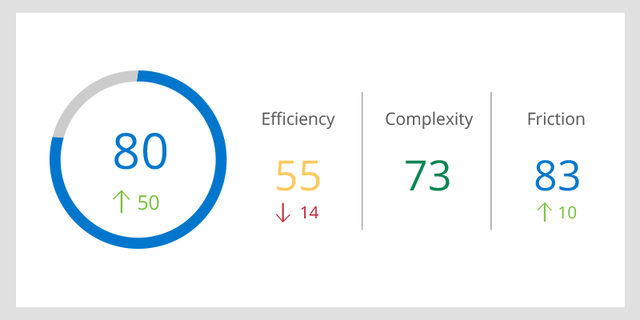
Process problems can frequently boil down to three major categories – efficiency, complexity, and friction. Quantifying how processes are performing in these areas can help provide a more directed focus on where to begin efforts, as well as measure their progress over time. To ensure success, operations leaders need to know the score at every level of the organization.
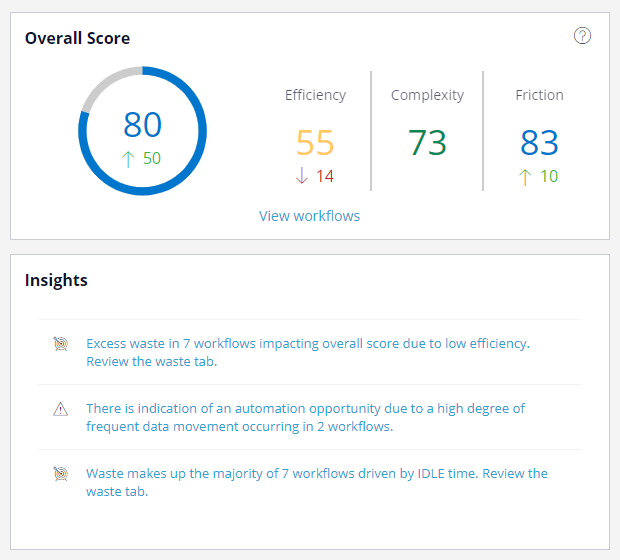
In the example above from a Pega Workforce Intelligence dashboard, the user is seeing an overall increase in process effectiveness. At the same time, however, efficiency is down substantially. Going beyond just the high-level scoring, the application uses AI to suggest targeted actions to improve process efficiency while reducing complexity and friction. In this example, waste and frequent data movement are the likely culprits for the lowered efficiency score. The workflow scoring dashboard gives tangible recommendations on how to respond (reviewing waste, exploring automation, and reducing idle time) to drive the score back to a more acceptable level. Thus, enterprise operations “score keepers” can easily spot anomalies and take immediate action.
Targeting improvements to streamline processes
From a company-wide level to individual groups, divisions, and teams, and all the way down to individual workers, knowing how each level is performing sets up process improvement efforts for victory through the targeted application of intelligent automation. As enterprises embrace remote work, digital transformation, and customer centricity, knowing the score and staying on top of desktop process effectiveness will only become more critical for success.
Learn how Pega Workforce Intelligence can provide the right analytics to help you keep score on desktop processes:
- Watch this video to see an overview of Pega Workforce Intelligence.
- Hear EY’s point-of-view on using Workforce Intelligence for data-driven transformation.
- See how Link Market Services uses desktop data to meet the goals of their Target Operating Model.
- Read this e-book to learn how desktop process analytics are Demystifying the Desktop for a better employee experience.
- Watch this PegaWorld iNspire presentation to learn how Desktop Mining, RPA, and Low-Code work together to improve business outcomes.